The builder's **Test** mode renders your view with real data while you are editing it. Use it to verify that placeholders resolve, forms submit correctly, and conditional visibility behaves as expected -- before anyone else opens the view.
Interface Builder has no separate publish step. Every edit you make is auto-saved and goes live immediately for anyone who opens the view in Pipedrive, so Test mode is the safest place to experiment.
## Opening Test Mode
1. Open the view in the builder.
2. Click the **Test** button in the top bar (next to **Preview** / **Sample data**).
The builder switches to Test mode: a single toolbar runs along the top of the canvas, with the rendered view below it.
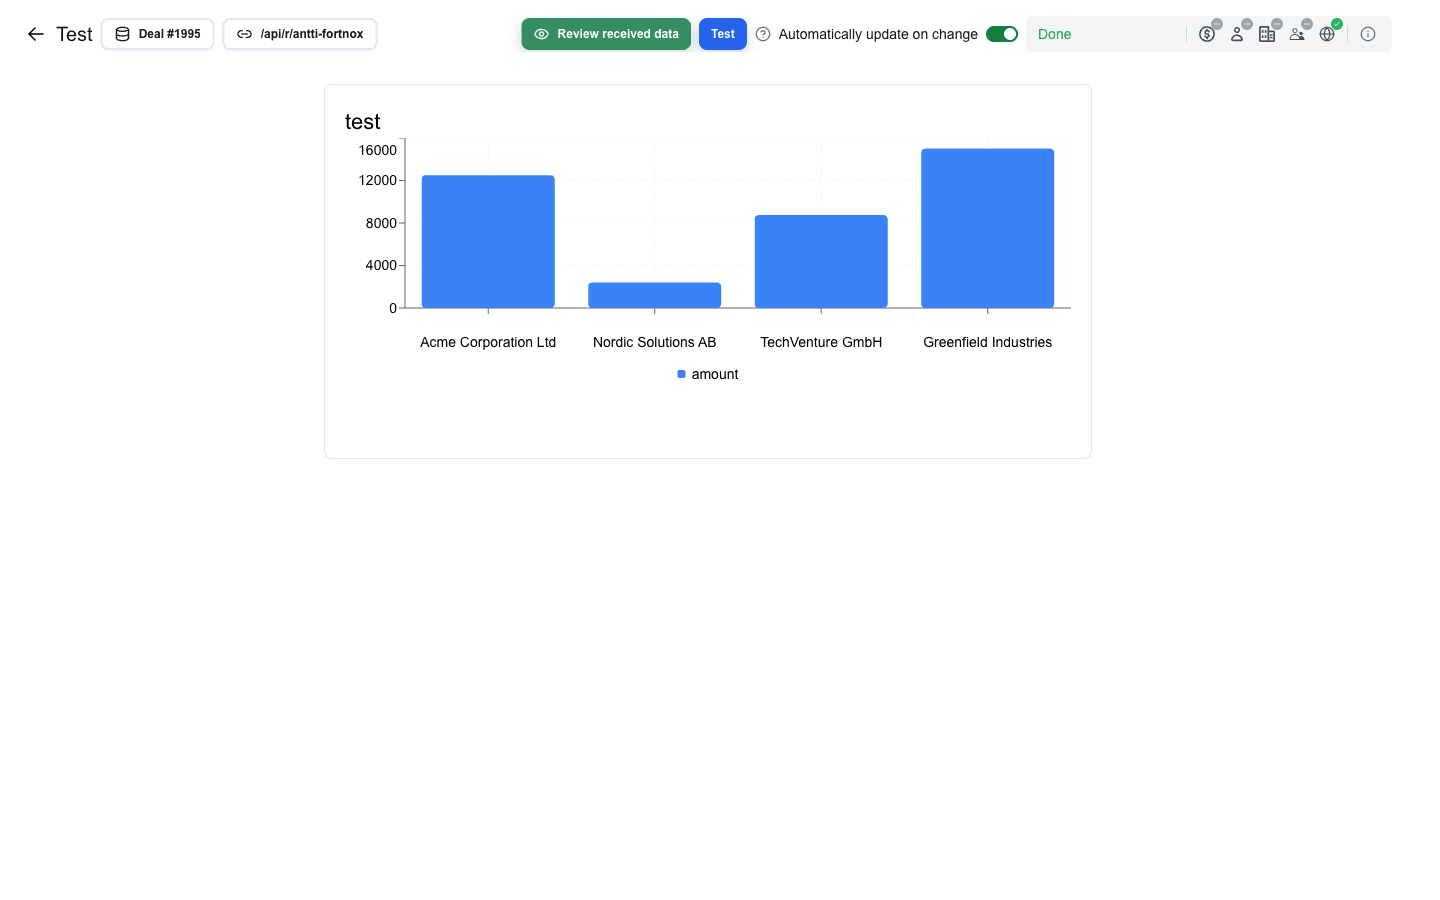 The back arrow on the left returns to the builder.
## Picking a Pipedrive Record
The toolbar shows the active resource as a button labelled ` #` (for example, `Deal #1995`). Click it to open the **Pipedrive resource** dialog and pick a different record.
1. Pick a resource type -- **deal**, **person**, or **organization**.
2. Pick a specific record from the list.
3. Close the dialog.
The preview reloads with that record's data. Every Data Picker placeholder bound to a Pipedrive field (for example `{{deal.title}}`) resolves to the real value.
A [floating window button](/docs/buttons/interface-button/interface-builder/explanation/floating-window-buttons) has no record to pick, so its Test and Preview toolbars do not show the resource button at all.
## Tweaking the External Data Source
If your view has a Data Source URL configured, click the URL button on the toolbar (Link icon, label is the path of the configured URL). The **View parameter** dialog opens and lets you tweak the request without editing the saved view configuration:
- **URL path** -- override the path the test calls.
- **Query parameters** -- add, edit, or remove key/value pairs. Duplicate keys collapse into a single row whose value reads `(multiple)`.
Closing the dialog re-runs the request and re-renders the view.
## Reviewing the Backend Response
Click **Review received data** (eye icon, green button) to see the JSON your data source actually returned, along with the HTTP status. Use this when placeholders look empty or wrong -- it tells you whether the backend sent what you expected. The dialog is empty until a backend response arrives -- it never falls back to your saved Sample data. If your view has no data source configured, switch to **Preview** to see how Sample data renders.
## Manual vs Automatic Reload
The **Automatically update on change** switch on the right of the toolbar controls when reloads happen.
- **On** (default) -- the preview reloads automatically whenever you change the resource, the URL path, or any query parameter.
- **Off** -- changes are buffered. Click the **Test** action button to fetch the data and re-render manually. Useful when you are making many small edits.
Your preference is stored in browser localStorage (`autoloadEnabled`), so it persists across sessions.
## What Test Mode Is Not
- It does **not** gate your edits. There is no publish step -- whatever you have saved in the builder is already what users see. Test mode is just a convenient way to render the same view with real records while you keep editing.
- It does **not** replace real end-user validation -- the preview runs in the builder, not in the Pipedrive panel where your users actually see the view.
## Troubleshooting
- **Toast `Request timed out. No custom data received.`** -- your Data Source URL backend did not respond within ~20 seconds. Check your backend logs.
- **Toast `Data loading failed (status 500)`** -- your Data Source URL returned a non-2xx status. The status code is shown in the toast.
- **Placeholders show literal text** -- the data needed to resolve them is missing. Check that you selected a Pipedrive record, or that your Data Source URL returned the fields you expect. Use **Review received data** to confirm what arrived.
See [External Data Source](/docs/buttons/interface-button/interface-builder/how-to/data/external-data-source) for configuring the URL that Test mode calls.