The Chart block renders a bar, line, area, or pie chart from an array in your data.
 ## Settings
| Setting | Description |
|---|---|
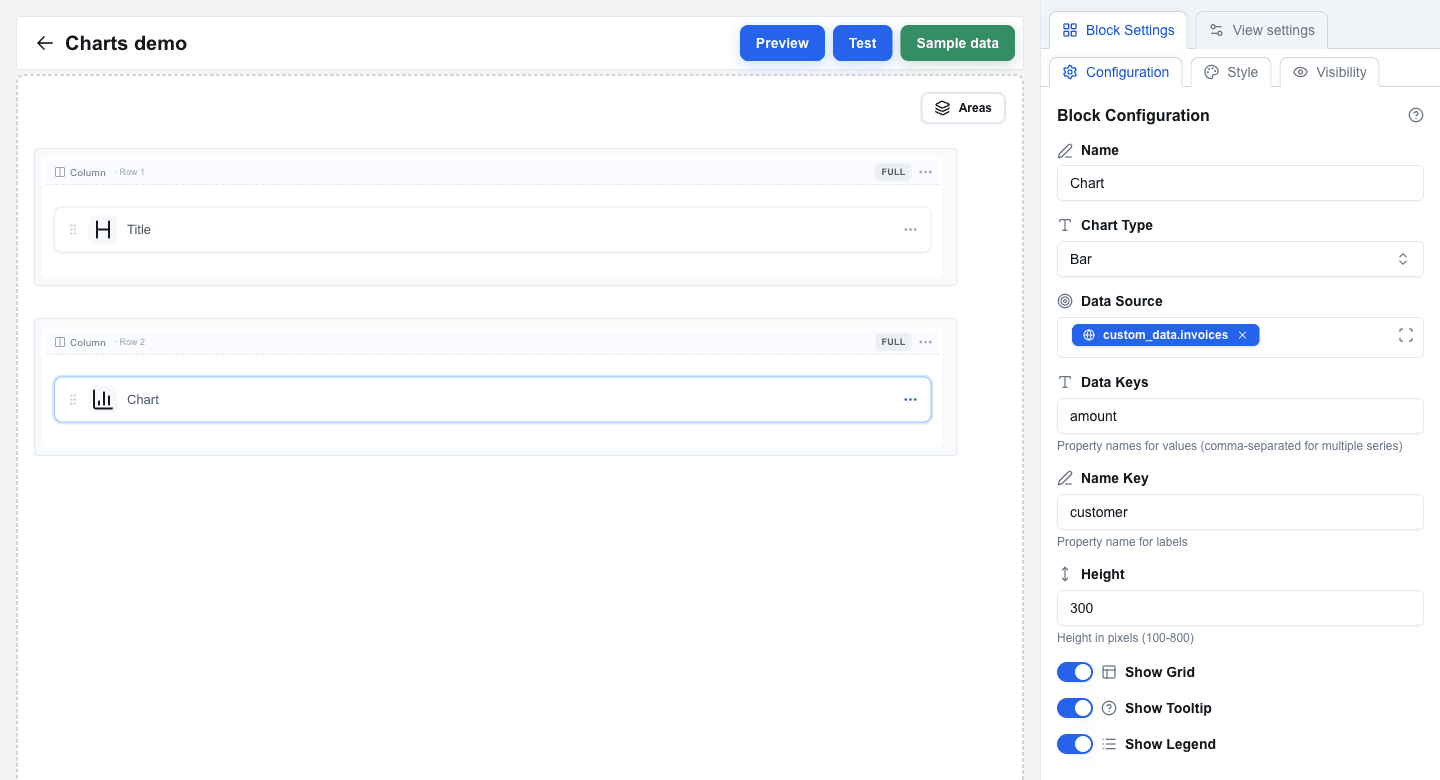
| **Chart Type** | Pick **Bar**, **Line**, **Area**, or **Pie** (default: Bar). |
| **Data Source** | Bind to an array using the Data Picker. Each item in the array becomes a data point. |
| **Data Keys** | Property names to plot, comma-separated. One name for a single series (for example `amount`), multiple for a multi-series chart (for example `desktop,mobile`). Default: `value`. |
| **Name Key** | The property used for the category label on the X axis or pie segment (for example `customer` or `name`). Default: `name`. |
| **Height** | Chart height in pixels, between 100 and 800 (default: 300). |
| **Show Grid** | Show background grid lines. On by default. |
| **Show Tooltip** | Show a tooltip when hovering a data point. On by default. |
| **Show Legend** | Show a legend below the chart. Off by default. |
## Data Shape
**Data Source** must resolve to an array of objects. Each object needs:
- A property whose name matches **Name Key** -- this is the category label.
- One or more properties whose names match the entries in **Data Keys** -- these are the numeric values plotted.
Single-series example (matches the chart above):
```json
[
{ "customer": "Acme Corporation Ltd", "amount": 12500 },
{ "customer": "Nordic Solutions AB", "amount": 2400 },
{ "customer": "TechVenture GmbH", "amount": 8750 },
{ "customer": "Greenfield Industries", "amount": 15000 }
]
```
With **Name Key** = `customer` and **Data Keys** = `amount`, this renders one bar per customer.
Multi-series example:
```json
[
{ "name": "Jan", "desktop": 186, "mobile": 80 },
{ "name": "Feb", "desktop": 305, "mobile": 200 }
]
```
With **Name Key** = `name` and **Data Keys** = `desktop,mobile`, the same data renders as a two-series chart with one bar (or line/area) per series per month.
 ## Style and Visibility
The Chart block uses the standard **Style** sub-tab (background, borders, radius) and **Visibility** sub-tab in Block Settings, the same as every other block. See [Block Styles](/docs/buttons/interface-button/interface-builder/reference/styles/block-styles) and [Conditional Visibility](/docs/buttons/interface-button/interface-builder/how-to/visibility/conditional-visibility).